This site uses cookies to improve your experience. To help us insure we adhere to various privacy regulations, please select your country/region of residence. If you do not select a country, we will assume you are from the United States. Select your Cookie Settings or view our Privacy Policy and Terms of Use.
Cookie Settings
Cookies and similar technologies are used on this website for proper function of the website, for tracking performance analytics and for marketing purposes. We and some of our third-party providers may use cookie data for various purposes. Please review the cookie settings below and choose your preference.
Used for the proper function of the website
Used for monitoring website traffic and interactions
Cookie Settings
Cookies and similar technologies are used on this website for proper function of the website, for tracking performance analytics and for marketing purposes. We and some of our third-party providers may use cookie data for various purposes. Please review the cookie settings below and choose your preference.
Strictly Necessary: Used for the proper function of the website
Performance/Analytics: Used for monitoring website traffic and interactions
This article explores 20 diverse PowerBI dashboard examples, showcasing how data can be transformed into actionable insights. Importance of Dashboards Dashboards […] The post 20 Examples of Interactive PowerBI Dashboards appeared first on Analytics Vidhya.
Introduction Microsoft’s PowerBI is one of its rapidly growing corporate analytics services. The post Microsoft’s PowerBI Interview Questions appeared first on Analytics Vidhya. This self-service business intelligence tool is the latest and greatest in the data-driven industry.
What is PowerBI? Microsoft‘s business analytics product, PowerBI, delivers interactive data visualization BI capabilities that allow users to see and share data and insights throughout their organisation. The post Getting Started with Data Analysis using PowerBI appeared first on Analytics Vidhya.
Table of contents Introduction What is Microsoft PowerBI? Microsoft PowerBI Concepts Data sources in Microsoft PowerBI Import Excel Data to Microsoft PowerBI Query Editor Inbuilt visuals Conclusion Introduction There is so much data collected in businesses and industries today. […].
Introduction BI tools, including software services, apps, and data connectors, make up the Microsoft PowerBI portfolio. The post Understand the Workings of PowerBI appeared first on Analytics Vidhya. Data from many sources are combined into a single dataset in this cloud-based platform.
Overview A demonstration of statistical analytics by Integrating Python within PowerBI Share the findings using dashboards and reports Introduction PowerBI is. The post Integrating Python in PowerBI: Get the best of both worlds appeared first on Analytics Vidhya.
The post Time Series Forecasting using Microsoft PowerBI appeared first on Analytics Vidhya. Introduction Time series forecasting is a really important area of Machine Learning as it gives you the ability to “see” ahead of time and.
PowerBI and Tableau, popular and user-friendly data visualization tools, help businesses organize large datasets. While both software are crucial for efficient data organization, comparing Power […] The post PowerBI vs Tableau: Similarities and Differences appeared first on Analytics Vidhya.
Microsoft’s PowerBI tool is an […] The post Most Used 10 PowerBI Charts appeared first on Analytics Vidhya. Visualizations close the gap between big data and a more understandable realization of the data provided.
Introduction PowerBI has emerged as a formidable tool within data science, enabling businesses to formulate informed decisions rooted in data-driven insights. Developed by Microsoft, PowerBI Visualizations empower users to visually represent their data and disseminate insights seamlessly across organizational echelons.
The post Building your First PowerBI Report from Scratch appeared first on Analytics Vidhya. What is equally important here is the ability to communicate the data and insights from your predictive models through reports and dashboards. And […].
Overview Understand the importance of Time Intelligence functions in PowerBI Implement Time Intelligence functions in PowerBI with a simple example Introduction. The post Time Intelligence in PowerBI: Capitalize on time appeared first on Analytics Vidhya.
It is at this juncture that PowerBI Semantic Models are useful. They also work in the capacity of […] The post What are PowerBI Semantic Models? It may not be easy to incorporate, sort and analyze such information for presentation purposes to be meaningful. appeared first on Analytics Vidhya.
Image 1 Introduction In this guide, we explore new BI Technology known as Microsoft PowerBI and let us learn some basics of it before we deep dive. The post A Comprehensive Guide on PowerBI appeared first on Analytics Vidhya.
Among numerous available exciting career choices, PowerBI developer is one of the intriguing career options among professionals. Multiple career growth options are available in the field with reasonably accurate salaries to […] The post How to Become a PowerBI Developer? appeared first on Analytics Vidhya.
Introduction PowerBI uses a set of functions, operators, and constants called DAX to perform dynamic computations and analysis. One can enhance their PowerBI competency by using DAX features that help in data modeling and reporting. This article examines the top DAX features that any PowerBI user should know.
ArticleVideo Book Overview Understand how to create map-based visualizations in PowerBI Explore and compare Bing and ArcGIS maps in PowerBI Introduction In. The post Map-based visualizations in PowerBI – Bing or ArcGIS? Take your call! appeared first on Analytics Vidhya.
The post Design Thinking in PowerBI appeared first on Analytics Vidhya. ArticleVideos This article was published as a part of the Data Science Blogathon. An Illustration using the Business Model Canvas Design Thinking is a.
However, with better data visualization, all […] The post How to Create a PowerBI Heatmap? Dealing with and interpreting raw data is never easy, but knowing how to look for essential patterns can be tough, too. appeared first on Analytics Vidhya.
Introduction If you’re new to PowerBI Desktop, this post is for you. The post Complete Introduction to DAX in PowerBI appeared first on Analytics Vidhya. You’ll learn the fundamentals of Data Analysis Expressions (DAX) and how to apply them to common math and data analysis tasks in no time.
Introduction Welcome, data enthusiasts and aspiring PowerBI professionals! If you’re gearing up for a PowerBI interview, you’re probably aware of the dynamic nature of the business intelligence world.
Both MS Excel and PowerBI offer impressive capabilities regarding data analysis and decision-making. This […] The post Excel vs PowerBI – Which is a Better for Decision Making? Understanding popular business intelligence tools and their unique features is crucial for harnessing their true potential.
Introduction to PowerBI By interpreting raw data into visual representations such as images, diagrams, videos, graphs, and more, PowerBi Custom Visualization allows you to gain insights from your data. The post Top 5 Custom Visuals in PowerBI appeared first on Analytics Vidhya.
Introduction PowerBI is one of the most popular data visualization and analytics software product developed by Microsoft. PowerBI interviews will provide insights from a variety of data by modelling data and telling stories from data visualizations using reports and dashboards. Source: [link] […].
Introduction to PowerBI In today’s data-driven age, a large amount of data gets generated daily from various sources such as supply chain and logistics, emails and multi-media, e-commerce websites, healthcare, transaction processing systems, etc. This article was published as a part of the Data Science Blogathon.
Microsoft PowerBI is a collection of apps, software services, The post Rise of Microsoft PowerBI as a Data Analytics powerhouse appeared first on Analytics Vidhya. ArticleVideo Book This article was published as a part of the Data Science Blogathon.
The post Exploratory Analysis Using SPSS, PowerBI, R Studio, Excel & Orange appeared first on Analytics Vidhya. Introduction There’s a lot of talk about Business Analytics in today’s corporate world. But why is it so? Is it just another trend that.
PowerBI is an influential tool, shaping raw data into informative visuals and reports. With a user-friendly interface and formidable functionalities, PowerBI is an invaluable platform for individuals to refine their skills through hands-on projects.
Introduction on PowerBI As part of our discussion, we will discuss the features of PowerBI, its benefits, and a detailed description of how to use it for presenting data using an example and creating reports. The post An End-to-End Introduction Guide on PowerBI appeared first on Analytics Vidhya.
Introduction PowerBI is a freely available tool from Microsoft for business analytics. Whether you’re a data scientist, an analyst, or a business user, PowerBI is a must-know tool that can make your work a lot easier. It helps you visualize data and seamlessly share the insights from it with stakeholders.
This guide walks you through the steps that will allow you to create easily updatable, automated and scalable PowerBI / Tableau dashboards. Although dashboards have become quite an integral part of performance tracking in organizations, implementing them can be tricky even for the most experienced analysts.
Introduction We have worked on plenty of drag-and-drop tools in our business intelligence (BI) journey. The post 10 Useful Data Analysis Expressions (DAX) Functions for PowerBI Beginners appeared first on Analytics Vidhya. But none has come close to matching the Swiss.
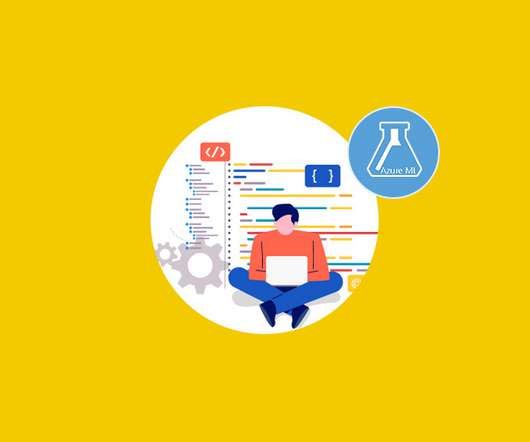
Overview Learn about the integration capabilities of PowerBI with Azure Machine Learning (ML) Understand how to deploy machine learning models in a production. The post The Power of Azure ML and PowerBI: Dataflows and Model Deployment appeared first on Analytics Vidhya.
PowerBI is a powerful data visualization tool that helps them turn raw data into meaningful insights and actionable decisions. In this blog, we will explore the role of data analysts and how they use PowerBI to extract insights from data and drive business success. How does a data analyst use PowerBI?
Unlock the potential of your data with Databricks' AI/BI Genie spaces! This blog post explores how to create a Genie space using a World of Warcraft dataset, enabling users to interactively query data and gain insights like a data analyst.
Are you geared to create a sales dashboard on PowerBI and track key performance indicators to drive sales success? Creating a sales dashboard in PowerBI is a straightforward process that can help your sales team to track key performance indicators (KPIs) and make data-driven decisions. Excel, SQL Server, etc.).
Summary: This PowerBI DAX tutorial introduces beginners to the fundamentals of Data Analysis Expressions, including syntax, functions, and context. Introduction In the world of Business Intelligence , PowerBI is a leading tool for Data Analysis and visualization. What is DAX?
Creating a visual that includes profit amount and profit margin is easy if you know the right DAX expressions to use in PowerBI. The post How to calculate profit margin in Microsoft PowerBI using a calculated column appeared first on TechRepublic.
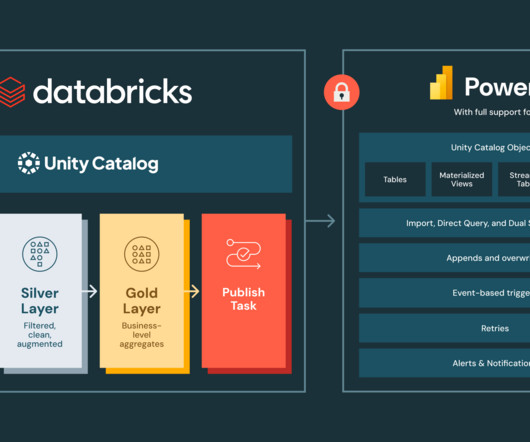
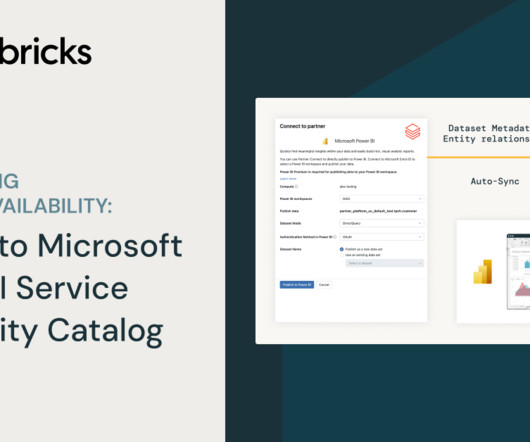
This is a collaborative post from Databricks and Microsoft. We thank Mahesh Prakriya (Director in Intelligence Platform, Microsoft) and Bob Zhang (Sr. Technical.
Discover the full potential of Copilot in PowerBI with our step-by-step tutorial. From data analysis to reporting, we guide you through harnessing its capabilities effortlessly.
DataCamp offers over 400 interactive courses, projects, and career tracks in the most popular data technologies such as Python, SQL, R, PowerBI, and Tableau. Start today and save up to 67% on career-advancing learning.
We organize all of the trending information in your field so you don't have to. Join 17,000+ users and stay up to date on the latest articles your peers are reading.
You know about us, now we want to get to know you!
Let's personalize your content
Let's get even more personalized
We recognize your account from another site in our network, please click 'Send Email' below to continue with verifying your account and setting a password.


Let's personalize your content