This site uses cookies to improve your experience. To help us insure we adhere to various privacy regulations, please select your country/region of residence. If you do not select a country, we will assume you are from the United States. Select your Cookie Settings or view our Privacy Policy and Terms of Use.
Cookie Settings
Cookies and similar technologies are used on this website for proper function of the website, for tracking performance analytics and for marketing purposes. We and some of our third-party providers may use cookie data for various purposes. Please review the cookie settings below and choose your preference.
Used for the proper function of the website
Used for monitoring website traffic and interactions
Cookie Settings
Cookies and similar technologies are used on this website for proper function of the website, for tracking performance analytics and for marketing purposes. We and some of our third-party providers may use cookie data for various purposes. Please review the cookie settings below and choose your preference.
Strictly Necessary: Used for the proper function of the website
Performance/Analytics: Used for monitoring website traffic and interactions
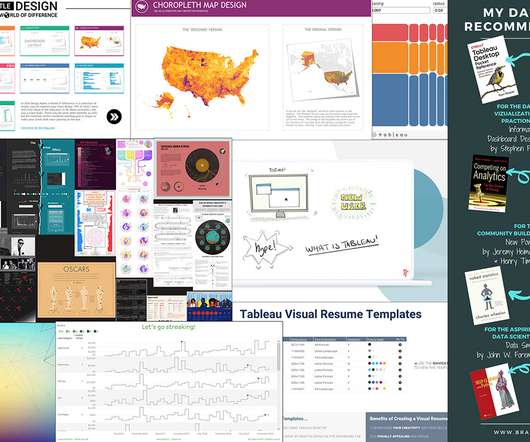
Overview A look at 11 mind-blowing and innovative data visualizations in Python, R, Tableau and D3.js The post 11 Innovative Data Visualizations you Should Learn (in Python, R, Tableau and D3.js) js These data visualizations span a variety of real-world. js) appeared first on Analytics Vidhya.
Introduction Tableau is a powerful and advanced visualization tool. Starting with Tableau Prep Builder, you can effectively clean, transform, and source data under one roof. It covers the whole visual development lifecycle. appeared first on Analytics Vidhya.
Whether accept it or not, I have seen people rejecting Tableau visuals for Excel. Even in conversations with my current organization’s CEO, he acknowledged that Excel is the only tool that […] The post Master Guide for Excel Automation Using Python appeared first on Analytics Vidhya.
The post Customer Segmentation using RFM Analysis in Tableau appeared first on Analytics Vidhya. Introduction Customer segmentation is the process by which we divide customers into groups based on common characteristics like demographics (age, gender, income, etc.), geography, psychology, and behavior.
These courses will cover data analysis with Python, R, SQL, PowerBI, Tableau, Excel, and SPSS. Learn data analytics by taking the best YouTube courses.
DataCamp offers over 400 interactive courses, projects, and career tracks in the most popular data technologies such as Python, SQL, R, Power BI, and Tableau. Start today and save up to 67% on career-advancing learning.
Key Skills Proficiency in SQL is essential, along with experience in data visualization tools such as Tableau or Power BI. Additionally, knowledge of programming languages like Python or R can be beneficial for advanced analytics. Programming Questions Data science roles typically require knowledge of Python, SQL, R, or Hadoop.
Spencer Czapiewski August 6, 2024 - 6:34pm Kyle Massey VP Lead Software Engineer Kyle Massey, a two-time Tableau DataDev Ambassador and co-leader of the DataPride Tableau User Group, shares his experience with VizQL Data Service. It’s one of the things that makes Tableau so easy to get started with. What is VizQL Data Service?
Product Manager, Tableau. First thing’s first: I am thrilled to announce that Tableau’s analytics extensions are now available in Tableau Online! Starting with R integration in Tableau 8.3, All of these steps have led up to support for integrating Python, R, and other analytics extensions in Tableau Online.
Sponsored Content “Completing the program has provided me with proficiency in essential data science methodologies and programming languages, including R, Python, SQL, and Tableau. Additionally, the program's flexibility allowed me to select project subjects aligned with my interests, fostering hands-on learning experiences.
Chief Technology Officer, Tableau. One of the things we’re focused on at Tableau is how to get more people using data in the daily routine of business. We want to reduce those barriers by introducing a new class of analytics: Tableau Business Science. What is Tableau Business Science? Who is Tableau Business Science for?
National Solutions Engineer, Tableau . Hello, and welcome to the Best of the Tableau Web! One of the greatest gifts that the Tableau Community gives the world, aside from beautiful visualizations, is learning content. Learning Tableau, or anything for that matter, takes three things: time, patience, and practice.
At the root, an Analytics Extension is a server that you stand up to receive data from Tableau in real-time. Similar to creating a calculated field in Tableau, you call a MODEL_EXTENSION function with the parameters of the model name, the arguments and the expression in the order expected by the model.
Guest author, Tableau DataDev Ambassador. Tableau is an innovator in the field of data visualization with its ease of use, stunning visualizations, vibrant community, and more contributing to success. Tableau recognizes that the way we use data today and the field of analytics is much different now than even a decade ago.
Guest author, Tableau DataDev Ambassador. Tableau is an innovator in the field of data visualization with its ease of use, stunning visualizations, vibrant community, and more contributing to success. Tableau recognizes that the way we use data today and the field of analytics is much different now than even a decade ago.
National Solutions Engineer, Tableau . Last month, Andy was discussing the value and the breadth of all the Tableau Community projects, and one of those is a new kid on the block called Back to Viz Basics (B2VB). Click to see Darragh's full interactive viz on Tableau Public. Tableau Coxcomb Chart Template. Bronwen Boyd.
National Solutions Engineer, Tableau . Last month, Andy was discussing the value and the breadth of all the Tableau Community projects, and one of those is a new kid on the block called Back to Viz Basics (B2VB). Click to see Darragh's full interactive viz on Tableau Public. Tableau Coxcomb Chart Template. Bronwen Boyd.
Python, R, and SQL: These are the most popular programming languages for data science. Libraries and Tools: Libraries like Pandas, NumPy, Scikit-learn, Matplotlib, Seaborn, and Tableau are like specialized tools for data analysis, visualization, and machine learning.
At the root, an Analytics Extension is a server that you stand up to receive data from Tableau in real-time. Similar to creating a calculated field in Tableau, you call a MODEL_EXTENSION function with the parameters of the model name, the arguments, and the expression in the order expected by the model.
Kuber Sharma Director, Product Marketing, Tableau Kristin Adderson August 22, 2023 - 12:11am August 22, 2023 Whether you're a novice data analyst exploring the possibilities of Tableau or a leader with years of experience using VizQL to gain advanced insights—this is your list of key Tableau features you should know, from A to Z.
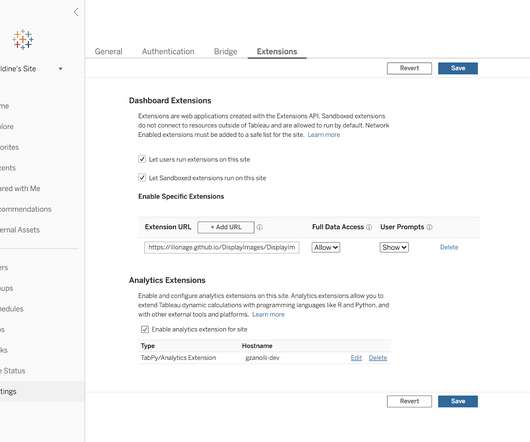
Each month, our Developer Platform team pulls back the curtain on recent work to support our developer community during the monthly Tableau Developer Program Sprint Demos. You asked—Tableau Online now supports Analytics Extensions . This feature has been used for prescriptive analytics or sentiment analysis in Tableau.
Gartner has again recognized Tableau as a Leader—for our ninth consecutive year. . I first want to thank you, the Tableau Community, for your continued support and your commitment to data, to Tableau, and to each other. With your input, we released more than 200 new capabilities across the Tableau platform in 2020.
TableauTableau is a powerful data visualization tool that allows users to connect to a wide range of data sources and create interactive dashboards and visualizations. Tableau is easy to use and provides a range of visualization options that are customizable to suit different needs.
It is similar to TensorFlow, but it is designed to be more Pythonic. Scikit-learn Scikit-learn is an open-source machine learning library for Python. It has a wide range of machine 6: TableauTableau is a data visualization software platform that can be used to create interactive dashboards and reports.
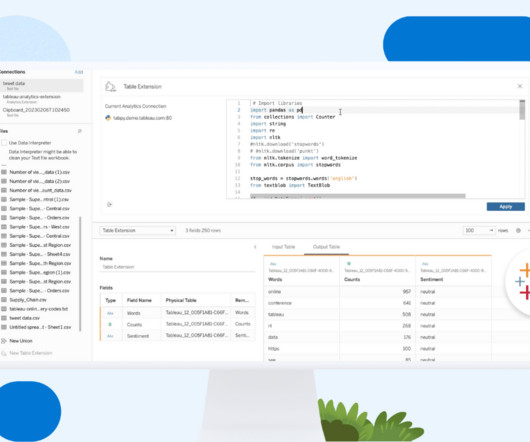
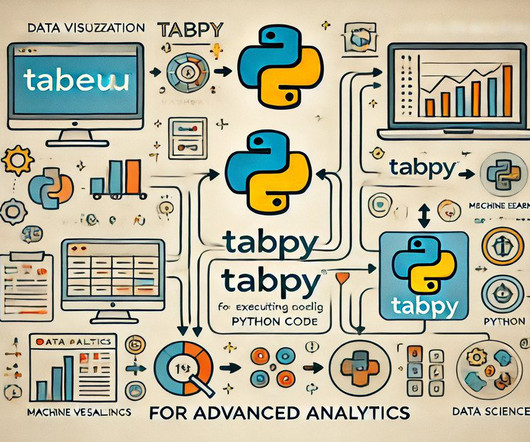
Summary: Incorporating TabPy into Tableau allows users to execute Python scripts directly within their dashboards, significantly enhancing analytical capabilities. One powerful combination is the integration of TabPy (TableauPython Server) with Tableau , a leading data visualisation tool. What is TabPy?
It provides high-speed, in-memory data processing capabilities and supports various programming languages like Scala, Java, Python, and R. 10 Tableau: Tableau is a widely used business intelligence and data visualization tool. Tableau connects to various data sources, including data warehouses, spreadsheets, and cloud services.
Python, R, and SQL: These are the most popular programming languages for data science. Libraries and Tools: Libraries like Pandas, NumPy, Scikit-learn, Matplotlib, Seaborn, and Tableau are like specialized tools for data analysis, visualization, and machine learning.
Tableau can help! By leveraging Tableau for Data Analyst can boost efficiency, communicate clearly, uncover hidden patterns, and make data-driven decisions. Mastering Tableau elevates an analyst’s value and unlocks career opportunities. Mastering Tableau elevates an analyst’s value and unlocks career opportunities.
Chief Product Officer, Tableau. At Tableau, we are relentless in our mission to help people see and understand data. Earlier this year we shared the development of Tableau Business Science that brought the power of data science and AI to business people. Francois Ajenstat. Spencer Czapiewski. June 17, 2021 - 10:18pm.
Tableau is a data visualisation software helping you to generate graphics-rich reporting and analysing enormous volumes of data. With the help of Tableau, organisations have been able to mine and gather actionable insights from granular sources of data. But What is Tableau for Data Science and what are its advantages and disadvantages?
Two tools that have significantly impacted the data analytics landscape are KNIME and Tableau. Tableau, owned by Salesforce, is a leading tool for data visualization, allowing users to create interactive dashboards and reports for better data understanding and decision-making.
Director, Data Science and ML Products, Tableau. First thing’s first: I am thrilled to announce that Tableau’s analytics extensions are now available in Tableau Online! Starting with R integration in Tableau 8.3, Get started with analytics extensions in Tableau Online. Kristin Adderson. February 1, 2021 - 6:58pm.
National Solutions Engineer, Tableau. Hello, and welcome to the Best of the Tableau Web! One of the greatest gifts that the Tableau Community gives the world, aside from beautiful visualizations, is learning content. Learning Tableau, or anything for that matter, takes three things: time, patience, and practice.
Summary: Data Blending in Tableau is helpful in deriving multiple sources to gain comprehensive insights. Through intuitive drag-and-drop functionality, Tableau enables users to blend disparate datasets effortlessly, facilitating holistic data exploration. What is Data Blending in tableau with an example?
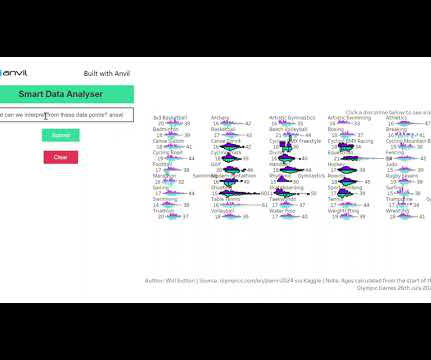
In this article we will walk through a demo of the PyGWalker package in Python. For this we will use NBA stats from the below web page: Continue reading on MLearning.ai »
Summary: Tableau is fantastic for data visualization, but understanding your data is key. Data types in Tableau act like labels, telling Tableau if it’s a number for calculations, text for labels, or a date for trends. Tableau recognizes numbers, dates, text, locations, and more.
They use data visualisation tools like Tableau and Power BI to create compelling reports. Programming languages such as Python and R are essential for advanced analytics. Key Features: Hands-on Training: Covers real-world Data Analysis methodologies, SQL , Python, and visualisation. Data Science Certification Course by Pickl.AI
They should be proficient in using tools like Tableau, PowerBI, or Python libraries like Matplotlib and Seaborn to create visually appealing and informative dashboards. They should be proficient in languages like Python, R or SQL to effectively analyze data and create custom scripts to automate data processing and analysis.
Chief Technology Officer, Tableau. One of the things we’re focused on at Tableau is how to get more people using data in the daily routine of business. We want to reduce those barriers by introducing a new class of analytics: Tableau Business Science. What is Tableau Business Science? Who is Tableau Business Science for?
Dashboards, such as those built using Tableau or Power BI , provide real-time visualizations that help track key performance indicators (KPIs). Programming languages like Python and R are commonly used for data manipulation, visualization, and statistical modeling. Data Scientists require a robust technical foundation.
Gartner has again recognized Tableau as a Leader—for our ninth consecutive year. . I first want to thank you, the Tableau Community, for your continued support and your commitment to data, to Tableau, and to each other. With your input, we released more than 200 new capabilities across the Tableau platform in 2020.
If you are a first-time user of Tableau, you will need to undergo short training to be able to use the tool. The best part about Tableau is the easy-to-use drag-and-drop user interface that makes it easy to create in-depth analysis and dashboards. With this tool, analysts are able to visualize complex data models in Python, SQL, and R.
The industry has evolved from relying on tools like SAS and R to placing a spotlight on data visualization tools like Tableau and PowerBI. Later, Python gained momentum and surpassed all programming languages, including Java, in popularity around 2018–19. Expand your skillset by… courses.analyticsvidhya.com 2.
We organize all of the trending information in your field so you don't have to. Join 17,000+ users and stay up to date on the latest articles your peers are reading.
You know about us, now we want to get to know you!
Let's personalize your content
Let's get even more personalized
We recognize your account from another site in our network, please click 'Send Email' below to continue with verifying your account and setting a password.


Let's personalize your content