This site uses cookies to improve your experience. To help us insure we adhere to various privacy regulations, please select your country/region of residence. If you do not select a country, we will assume you are from the United States. Select your Cookie Settings or view our Privacy Policy and Terms of Use.
Cookie Settings
Cookies and similar technologies are used on this website for proper function of the website, for tracking performance analytics and for marketing purposes. We and some of our third-party providers may use cookie data for various purposes. Please review the cookie settings below and choose your preference.
Used for the proper function of the website
Used for monitoring website traffic and interactions
Cookie Settings
Cookies and similar technologies are used on this website for proper function of the website, for tracking performance analytics and for marketing purposes. We and some of our third-party providers may use cookie data for various purposes. Please review the cookie settings below and choose your preference.
Strictly Necessary: Used for the proper function of the website
Performance/Analytics: Used for monitoring website traffic and interactions
Introduction Tableau is a data visualization tool created in Salesforce that allows users to connect to any database, like SQL or MongoDB, and interact freely. The post Most Frequently Asked Tableau Interview Questions appeared first on Analytics Vidhya. This article was published as a part of the Data Science Blogathon.
These courses will cover data analysis with Python, R, SQL, PowerBI, Tableau, Excel, and SPSS. Learn data analytics by taking the best YouTube courses.
Most In-demand Artificial Intelligence Skills To Learn In 2022 • The 5 Hardest Things to Do in SQL • 10 Most Used Tableau Functions • Decision Trees vs Random Forests, Explained • Decision Tree Algorithm, Explained.
DataCamp offers over 400 interactive courses, projects, and career tracks in the most popular data technologies such as Python, SQL, R, Power BI, and Tableau. Start today and save up to 67% on career-advancing learning.
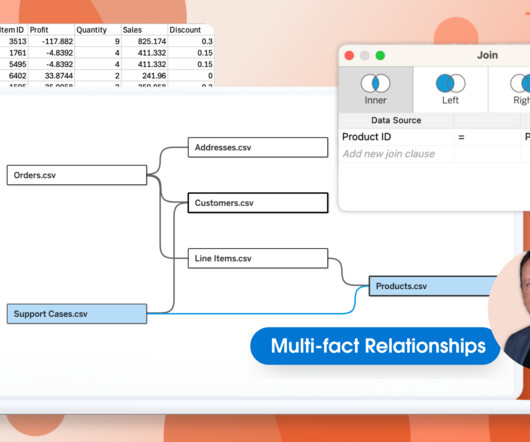
Spencer Czapiewski August 29, 2024 - 9:52pm Kirk Munroe Chief Analytics Officer & Founding Partner at Paint with Data Kirk Munroe, Chief Analytics Officer and Founding Partner at Paint with Data and Tableau DataDev Ambassador, explains the value of using relationships in your Tableau data models. How can this be possible?
Sponsored Content “Completing the program has provided me with proficiency in essential data science methodologies and programming languages, including R, Python, SQL, and Tableau. Additionally, the program's flexibility allowed me to select project subjects aligned with my interests, fostering hands-on learning experiences.
Spencer Czapiewski August 6, 2024 - 6:34pm Kyle Massey VP Lead Software Engineer Kyle Massey, a two-time Tableau DataDev Ambassador and co-leader of the DataPride Tableau User Group, shares his experience with VizQL Data Service. It’s one of the things that makes Tableau so easy to get started with. What is VizQL Data Service?
Technical Fellow, Tableau. Tableau has been helping people and organizations to see and understand data for almost two decades, bringing exciting innovations to the landscape of business intelligence with every product release. I am proud to announce that my History of Tableau Innovation viz is now published to Tableau Public.
Key Skills Proficiency in SQL is essential, along with experience in data visualization tools such as Tableau or Power BI. Programming Questions Data science roles typically require knowledge of Python, SQL, R, or Hadoop. Their role is crucial in understanding the underlying data structures and how to leverage them for insights.
This includes the creation of SQL Code, DACPAC files, SSIS packages, Data Factory ARM templates, and XMLA files. Support for Various Data Warehouses and Databases : AnalyticsCreator supports MS SQL Server 2012-2022, Azure SQL Database, Azure Synapse Analytics dedicated, and more. Data Lakes : It supports MS Azure Blob Storage.
Chief Product Officer, Tableau. Tableau and Google Cloud are partnering to help modernize your data and analytics infrastructure and unlock your data’s full value. With Tableau, any user can visually explore that data in real time. Governed, self-service with Tableau and Looker. Francois Ajenstat. Spencer Czapiewski.
In Tableau 2021.1, we’ve added new connectors to help our customers access more data in Azure than ever before: an Azure SQL Database connector and an Azure Data Lake Storage Gen2 connector. Azure SQL Database. Many customers rely on Azure SQL Database as a managed, cloud-hosted version of SQL Server.
Madeleine Corneli Senior Manager, Product Management, Tableau Adiascar Cisneros Manager, Product Management, Tableau Bronwen Boyd April 3, 2023 - 5:27pm April 3, 2023 Google Cloud’s BigQuery is a serverless, highly-scalable cloud-based data warehouse solution that allows users to store, query, and analyze large datasets quickly.
Product Marketing Specialist, Tableau. The newest release of Tableau is here! Tableau 2021.1 Upgrade to take advantage of these new innovations, and learn more about how Tableau brings AI into analytics to help users across your organization answer pressing questions. In Tableau 2021.1, In Tableau 2021.1,
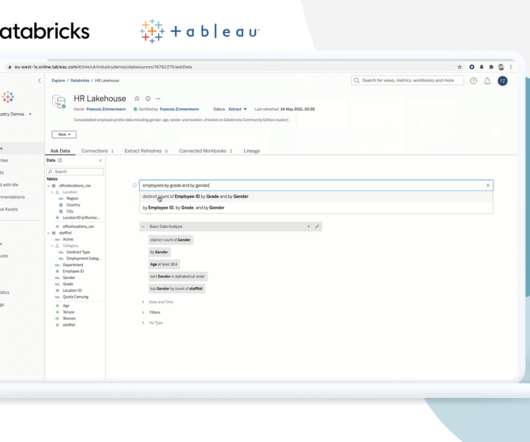
EMEA Field CTO, Tableau. We’ll also explore the technical synergy between Tableau and Databricks and how our customers typically use the two platforms together to maximize the value of their data. The lakehouse model provides distinct advantages for Tableau customers. Francois Zimmermann. Brian Dirking. Kristin Adderson.
At Tableau, we have had a front-row seat to the rising need for data skills across all organizations, all communities, and groups. Since 2011, Tableau Academic Programs have been supporting the growing need for data skills by offering free resources for learning and teaching Tableau in the classroom - 1.6 July 30, 2021.
Technical Fellow, Tableau. Tableau has been helping people and organizations to see and understand data for almost two decades, bringing exciting innovations to the landscape of business intelligence with every product release. I am proud to announce that my History of Tableau Innovation viz is now published to Tableau Public.
SVP, WW Partners and Alliances, Tableau. We just completed our annual Tableau Partner Executive Kick Offs (PEKO), where top partners from around the world join us virtually to celebrate all the great performances in 2020 and hear from Tableau executives on our direction for FY22. Kristin Adderson. March 9, 2021 - 11:04pm.
Kuber Sharma Director, Product Marketing, Tableau Kristin Adderson August 22, 2023 - 12:11am August 22, 2023 Whether you're a novice data analyst exploring the possibilities of Tableau or a leader with years of experience using VizQL to gain advanced insights—this is your list of key Tableau features you should know, from A to Z.
Python, R, and SQL: These are the most popular programming languages for data science. Libraries and Tools: Libraries like Pandas, NumPy, Scikit-learn, Matplotlib, Seaborn, and Tableau are like specialized tools for data analysis, visualization, and machine learning.
Chief Product Officer, Tableau. Tableau and Google Cloud are partnering to help modernize your data and analytics infrastructure and unlock your data’s full value. With Tableau, any user can visually explore that data in real time. Governed, self-service with Tableau and Looker. Francois Ajenstat. Spencer Czapiewski.
Product Marketing Associate, Tableau. Tableau 2022.1 Tableau workbook performance can have a huge effect on the analytics experience for individuals, plus there are implications for your organization at the technology level. To learn more, read Workbook Optimizer in Tableau Help. In Tableau 2022.1, Colten Woo.
Product Marketing Associate, Tableau. Tableau 2022.1 Tableau workbook performance can have a huge effect on the analytics experience for individuals, plus there are implications for your organization at the technology level. To learn more, read Workbook Optimizer in Tableau Help. In Tableau 2022.1, Colten Woo.
Though both are great to learn, what gets left out of the conversation is a simple yet powerful programming language that everyone in the data science world can agree on, SQL. But why is SQL, or Structured Query Language , so important to learn? Let’s start with the first clause often learned by new SQL users, the WHERE clause.
dbt focuses on transforming raw data into analytics-ready tables using SQL-based transformations. 10 Tableau: Tableau is a widely used business intelligence and data visualization tool. Tableau connects to various data sources, including data warehouses, spreadsheets, and cloud services.
If you are a first-time user of Tableau, you will need to undergo short training to be able to use the tool. The best part about Tableau is the easy-to-use drag-and-drop user interface that makes it easy to create in-depth analysis and dashboards. With this tool, analysts are able to visualize complex data models in Python, SQL, and R.
Summary: Tableau simplifies data visualisation with interactive dashboards, AI-driven insights, and seamless data integration. With mapping features, customisable charts, and automated analytics, Tableau enhances data-driven strategies, helping businesses extract valuable insights for better decision-making and operational efficiency.
In Tableau 2021.1, we’ve added new connectors to help our customers access more data in Azure than ever before: an Azure SQL Database connector and an Azure Data Lake Storage Gen2 connector. Azure SQL Database. Many customers rely on Azure SQL Database as a managed, cloud-hosted version of SQL Server.
Python, R, and SQL: These are the most popular programming languages for data science. Libraries and Tools: Libraries like Pandas, NumPy, Scikit-learn, Matplotlib, Seaborn, and Tableau are like specialized tools for data analysis, visualization, and machine learning.
The way to do this today is via impersonation, by which a server admin can impersonate a user, query as that user, and retrieve content that user has access to based on permissions within Tableau. Webhooks is a notification service that allows you to integrate Tableau with any external server. In the 2021.1 Auto-disable Webhooks.
These models process vast amounts of text data to learn language patterns, enabling them to respond to queries, summarize information, or even generate complex SQL queries based on natural language inputs. Interactive Dashboards : Dashboards dynamically adjust to emphasize the most relevant data, simplifying the decision-making process.
Tableau is a data visualisation software helping you to generate graphics-rich reporting and analysing enormous volumes of data. With the help of Tableau, organisations have been able to mine and gather actionable insights from granular sources of data. But What is Tableau for Data Science and what are its advantages and disadvantages?
Summary: Data Blending in Tableau is helpful in deriving multiple sources to gain comprehensive insights. Through intuitive drag-and-drop functionality, Tableau enables users to blend disparate datasets effortlessly, facilitating holistic data exploration. What is Data Blending in tableau with an example?
This could be anything from a business glossary term, to a table in a database, or a SQL query someone has published and described. Within Slack, she searches for an Alation SQL query about customers by industry. Within Slack, she searches for an Alation SQL query about customers by industry. Alation Anywhere for Tableau.
Madeleine Corneli Senior Manager, Product Management, Tableau Adiascar Cisneros Manager, Product Management, Tableau Bronwen Boyd April 3, 2023 - 5:27pm April 3, 2023 Google Cloud’s BigQuery is a serverless, highly-scalable cloud-based data warehouse solution that allows users to store, query, and analyze large datasets quickly.
Software like Microsoft Excel and SQL helps them manipulate and query data efficiently. They use data visualisation tools like Tableau and Power BI to create compelling reports. Key Features: Hands-on Training: Covers real-world Data Analysis methodologies, SQL , Python, and visualisation.
Summary: Data Visualisation is crucial to ensure effective representation of insights tableau vs power bi are two popular tools for this. This article compares Tableau and Power BI, examining their features, pricing, and suitability for different organisations. What is Tableau? billion in 2023. from 2022 to 2028.
Product Marketing Specialist, Tableau. The newest release of Tableau is here! Tableau 2021.1 Upgrade to take advantage of these new innovations, and learn more about how Tableau brings AI into analytics to help users across your organization answer pressing questions. In Tableau 2021.1, In Tableau 2021.1,
At Tableau, we have had a front-row seat to the rising need for data skills across all organizations, all communities, and groups. Since 2011, Tableau Academic Programs have been supporting the growing need for data skills by offering free resources for learning and teaching Tableau in the classroom - 1.6 July 30, 2021.
SQL or Structured Query Language has a significant role to play in conducting practical Data Analysis. That’s where SQL comes in, enabling data analysts to extract, manipulate and analyse data from multiple sources. That’s where SQL comes in, enabling data analysts to extract, manipulate and analyse data from multiple sources.
The easiest skill that a Data Science aspirant might develop is SQL. This blog would an introduction to SQL for Data Science which would cover important aspects of SQL, its need in Data Science, and features and applications of SQL. What is SQL? The full form of SQL stands for Structured Query Language.
EMEA Field CTO, Tableau. We’ll also explore the technical synergy between Tableau and Databricks and how our customers typically use the two platforms together to maximize the value of their data. The lakehouse model provides distinct advantages for Tableau customers. Francois Zimmermann. Brian Dirking. Kristin Adderson.
SVP, WW Partners and Alliances, Tableau. We just completed our annual Tableau Partner Executive Kick Offs (PEKO), where top partners from around the world join us virtually to celebrate all the great performances in 2020 and hear from Tableau executives on our direction for FY22. Kristin Adderson. 09/03/2021 - 11:04.
Dashboards, such as those built using Tableau or Power BI , provide real-time visualizations that help track key performance indicators (KPIs). Descriptive analytics is a fundamental method that summarizes past data using tools like Excel or SQL to generate reports. Data Scientists require a robust technical foundation.
We organize all of the trending information in your field so you don't have to. Join 17,000+ users and stay up to date on the latest articles your peers are reading.
You know about us, now we want to get to know you!
Let's personalize your content
Let's get even more personalized
We recognize your account from another site in our network, please click 'Send Email' below to continue with verifying your account and setting a password.


Let's personalize your content